管理人オススメコンテンツはこちら
「その『貧しい』は、誰が決めた?|貯金1,000万円でも裕福になれない理由。」
\NISAやるなら/
この記事は全4回シリーズです。裕福さをはかる3つのモノサシを順番に解説していきます。
第1回(この記事)
―貯金1,000万円でも裕福になれない理由
第2回
―本当の富をはかる残酷なモノサシ~あなたは働かずに何年生きられますか?
第3回
―あなたの家計は、何日目で黒字になりますか?
第4回
―他人のモノサシで自分をはかるな!あなたはどのタイプ?
まずは第1回から、順番にどうぞ。
今日は【総論】
お金持ちとは?
学校では教えてくれない本当の裕福さを測る3つの指標
というお話をします。
●その「貧しい」、誰が決めたんですか?
いきなりですが質問です。
「あなたは今、裕福ですか?」
……どうでしょう。
すぐに答えられましたか?
自分自身が今裕福かどうか?
回答は人によって
まちまちだと思います。
裕福だと思うと答えた人も
いや、全然と答えた人も
ちょっと立ち止まって考えてみてください。
あなたは今何を基準にして
そう判定しましたか?
実はここが
とても大事なところです。
多くの人は
自分に合っていない
モノサシで自分を測って
必要以上に自分は貧しいと
感じてしまっています。
正しいモノサシを持っていなければ
どれだけお金を増やしても
裕福さを実感することはできません。
今回のお話では
経済的な裕福さをはかる
3つの指標(モノサシ)を紹介します。
あなたにしっくりくるのはどれか
探しながら読んでみてください。
●そもそも「裕福」とは何か
まずは言葉の意味から
確認しておきましょう。
辞書によれば
裕福とは——
『財産や収入が豊かで生活に余裕が有る事』
(出典:デジタル大辞泉)
こう書いてあります。
つまり基本のモノサシは
この2つです。
・財産(資産)
・収入
まずはこの2つから見ていきます。
モノサシ1: 資産額
1つ目は『資産額』。
冒頭の質問に
『裕福だと思う』と
答えた人の中には
こんな理由の人が
いたのではないでしょうか。
「貯金が1,000万円あるから」
「土地や家屋を持っているから」
「有価証券が3,000万円あるから」
いずれも持っている財産の大きさで
判断していますよね。
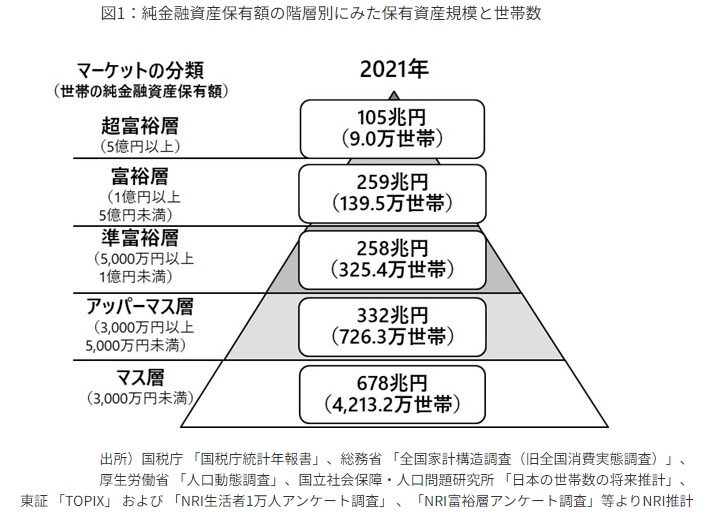
有名なのが
野村総合研究所が発表している
通称『金持ちピラミッド』。
(出典:https://www.nri.com/jp/news/newsrelease/20250213_1.html)
純金融資産保有額をモノサシにして
世帯を5つの層に分類したものです。
5億円以上の
純金融資産を持ってる人が
『超富裕層』
1〜5億円が
『富裕層』
5千万〜1億円が
『準富裕層』
3〜5千万円が
『アッパーマス層』
3千万円未満が
『マス層』
とランク付けされてるんですね。
ちなみにこちらのお話でお伝えしているのは
一部の人が超富裕層になる方法ではありません。
多くの人が現実的に到達できる
準富裕層=「小金持ち」になるための方法です。
ここがけっこう重要なポイントなので
覚えておいてください。
資産額は
裕福さをはかる最もメジャーな
モノサシのひとつ。
貯金額の数字ばかりを
気にしてしまう人が多いのも
うなずける話です。
モノサシ2:年収
2つ目は「年収」。
厚生労働省
『2025年国民生活基礎調査』による
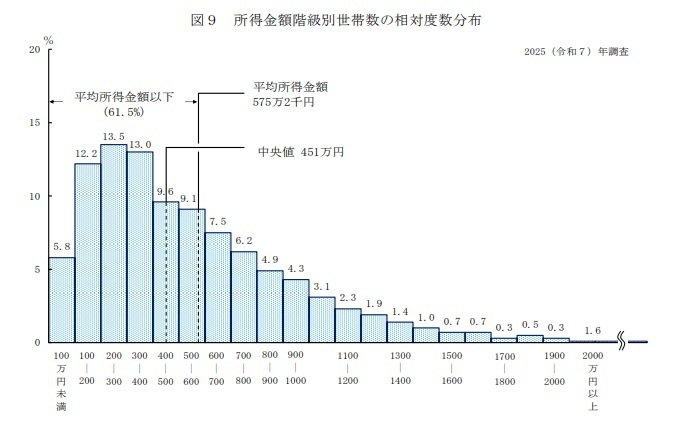
世帯所得の分布を見てみましょう。
厚生労働省の調査によると
世帯別の所得分布は次の通りです。
(出典:https://www.mhlw.go.jp/toukei/saikin/hw/k-tyosa/k-tyosa25/dl/03.pdf)
・平均値:575万2千円
・中央値:451万円
・平均以下の世帯:全体の 61.5%
・最も多い層:200〜300万円(13.5%)、次いで300〜400万円(13.0%)
・所得1,000万円以上の世帯:全体の 13.9%
・所得2,000万円以上の世帯:わずか 1.6%
こう並べてみると
年収1,000万円以上の世帯は
相対的にはたしかに裕福と言えそうです。
ちなみにこの平均値
前年から7.3%増と
過去最高の伸びでした。
これは
賃上げの影響とみられています。
ところが同じ調査で
生活が「苦しい」と答えた世帯は55.4%。
半数以上が苦しいと感じています。
平均は過去最高に伸びたのに
実感はまるでない。
この時点ですでに
嫌な予感がしませんか?
国レベルでも「所得」が指標になっている
面白いのは
国の豊かさを測るときにも
同じ発想が使われている点です。
その代表が
「1人あたりGNI(国民総所得)」。
世間でよく有る会社別の年収ランキング
その国バージョンだと思ってください。
2024年の
1人あたり名目GNI(国連統計)は
次の通りです。
| 順位 | 国・地域 | 1人あたりGNI |
| 1位 | モナコ | 288,002ドル(約4,350万円) |
| 4位 | スイス | 101,765ドル(約1,540万円) |
| 8位 | アメリカ | 83,935ドル(約1,270万円) |
| 46位 | 日本 | 34,470ドル(約520万円) |
| 世界計 | 13,576ドル(約205万円) | |
| 204位 | 中央アフリカ | 547ドル(約8万円) |
※円換算は1ドル≒151円(2024年平均レート)で計算。モナコやリヒテンシュタインなどの小国・属領も含めた順位です。
国も個人も
豊かさを測るときには
まず『稼ぎ』を見る。
だからこそ私たちもつい
「少しでも年収を上げたい」
と考えてしまうわけですね。
豊かさをはかる指標として
国民1人あたりGNIは
注目度が高まっている。
年収=所得というのは
重要な指標だという事ですね。
年収は資産額と並ぶ
メジャーなモノサシです。
これが
2つ目のモノサシ=年収でした。
〜〜〜つづく〜〜〜
Special Thanks college president Ryo.
 管理人_じっちょ
老後のために、まず投資口座を開いておきましょう。
無料・5分で完了です→【公式】楽天証券
●おまけ
≪≪perplexityちゃんによる文章まとめ≫≫
辞書によれば、裕福とは「財産や収入が豊かで生活に余裕があること」です。
1つ目の指標は「資産額」で、野村総合研究所の「金持ちピラミッド」が例示されています。純金融資産保有額により、超富裕層(5億円以上)、富裕層(1〜5億円)、準富裕層(5,000万〜1億円:多くの人が到達可能な「小金持ち」目標)、アッパーマス層(3,000万〜5,000万円)、マス層(3,000万円未満)に分類されます。
2つ目の指標は「年収」です。厚生労働省の2025年調査では、2024年の世帯平均所得は575万2千円(過去最高の伸び)、中央値451万円ですが、生活が「苦しい」と答えた世帯は55.4%に上ります。国の豊かさを測る1人あたりGNI(2024年)では、日本は46位(約520万円)で、アメリカ(約1,270万円)やスイス(約1,540万円)と差があります。
資産額と年収はメジャーな指標ですが、これらだけで裕福さを判断することの限界が示唆されています。
Citations:
[1]https://www.globalnote.jp/post-1353.html
[2]https://maninoblog.com/【2025年最新版】金持ちピラミッドから分かること/
[3]https://www.teikokushoin.co.jp/statistics/world/detail/152/
[4]https://www.tr.mufg.jp/life-shisan/method/syakaijin.html
[5]https://www.stat.go.jp/data/kakei/family/05.html
≪≪Chat-GPTくんによる英訳≫≫
Today’s Topic: The Big Picture
What Does It Really Mean to Be Wealthy?
Three measures of true wealth that schools never teach you.
【Who Decided You’re “Poor”?】
Let me start with a question.
Do you consider yourself wealthy right now?
How would you answer?
Could you answer immediately?
Whether you think you’re wealthy or not, the answer probably differs from person to person.
Some people would say, “Yes.”
Others would say, “Not at all.”
Before you answer, stop and think for a moment.
What standard did you use to make that judgment?
This is actually the most important point.
Many people measure themselves using the wrong yardstick.
As a result, they feel poorer than they really are.
Without the right way to measure wealth, no matter how much money you accumulate, you’ll never truly feel wealthy.
Today, I’ll introduce three different ways to measure financial wealth.
As you read, think about which one resonates with you the most.
【What Is “Wealth” in the First Place?】
Let’s begin with the definition.
According to the dictionary, wealth is:
“Having sufficient assets or income to live comfortably with financial security.”
(Source: Digital Daijisen Dictionary)
In other words, the two basic measures are:
- Assets
- Income
Let’s look at each one.
~Yardstick #1: Net Assets~
The first measure is net assets.
Some of you who answered “Yes, I’m wealthy” may have been thinking something like:
“Because I have ¥10 million in savings.”
“Because I own land and a house.”
“Because I have ¥30 million in securities.”
In every case, you’re judging your wealth by the size of your assets.
One famous example is the “Wealth Pyramid” published by the Nomura Research Institute (NRI).
(Source: https://www.nri.com/jp/news/newsrelease/20250213_1.html)
It classifies households into five groups based on their net financial assets.
Super Wealthy: ¥500 million or more
Wealthy: ¥100 million–500 million
Affluent: ¥50 million–100 million
Upper Mass: ¥30 million–50 million
Mass: Less than ¥30 million
By the way, this series is not about becoming part of the ultra-wealthy elite.
Instead, it’s about helping ordinary people realistically reach the Affluent level—what I like to call being comfortably well-off.
That’s an important distinction, so keep it in mind.
Asset value is one of the most common ways people measure wealth.
That’s why so many people become obsessed with the balance in their bank account.
~Yardstick #2: Annual Income~
The second measure is annual income.
Let’s look at the distribution of household income from Japan’s 2025 Comprehensive Survey of Living Conditions conducted by the Ministry of Health, Labour and Welfare.
(Source: https://www.mhlw.go.jp/toukei/saikin/hw/k-tyosa/k-tyosa25/dl/03.pdf)
According to the survey:
Average household income: ¥5.752 million
Median household income: ¥4.51 million
Households earning below the average: 61.5%
Largest income group: ¥2–3 million (13.5%), followed by ¥3–4 million (13.0%)
Households earning ¥10 million or more: 13.9%
Households earning ¥20 million or more: Only 1.6%
Looking at these numbers, households earning over ¥10 million a year can certainly be considered relatively affluent.
Incidentally, the average income increased 7.3% from the previous year, the largest increase on record.
This is believed to be largely due to wage increases.
However, the same survey also found that 55.4% of households said they were struggling financially.
More than half of all households still feel financially strained.
Income reached a record high…
Yet people don’t feel any richer.
Doesn’t that already suggest something is missing?
【Even Countries Measure Wealth by Income】
Interestingly, the same idea is used when measuring the wealth of entire nations.
A common indicator is Gross National Income (GNI) per capita.
Think of it as the country’s version of those “average salary by company” rankings you often see.
According to the United Nations’ 2024 nominal GNI per capita statistics:
Rank Country/Region GNI per Capita
1 Monaco US$288,002 (about ¥43.5 million)
4 Switzerland US$101,765 (about ¥15.4 million)
8 United States US$83,935 (about ¥12.7 million)
46 Japan US$34,470 (about ¥5.2 million)
World Average — US$13,576 (about ¥2.05 million)
204 Central African Republic US$547 (about ¥83,000)
Japanese yen conversions are based on the 2024 average exchange rate of approximately ¥151 per US dollar. Rankings include small states and territories such as Monaco and Liechtenstein.
Whether we’re talking about individuals or entire countries, the first thing people usually look at is income.
That’s why we naturally think,
“I just need to earn a little more.”
Today, GNI per capita is one of the most widely discussed indicators of national prosperity.
Just as annual income is an important indicator for individuals, national income plays the same role for countries.
Annual income, together with asset value, is one of the two most common yardsticks for measuring wealth.
And that brings us to the second yardstick: annual income.
Special Thanks OpenAI and Perplexity AI, Inc